PUMAS
WHAT IS IT?
PUMAS is our proprietary algorithm that enables us to maximise diversity in the room, track impact and match people based on what they know and what they want to learn.
Any student who participates in a TY Work Experience Programme or TY Challenge with us will be asked to fill out our PUMAS Smart Profile. The PUMAS Smart Profile asks students to fill out the skills they're good at and the skills they want to improve.
Our proprietary algorithm then looks at all of the Smart Profiles that have registered with us and generates groups according to gender diversity, school/company diversities, which also helps with geographical diversity, and skills diversity. The algorithm also remembers what groups the students were put into initially so that they're not put into the same group again.
Throughout the programme, we ask the students give feedback and rank their peers' skills. Students can see the feedback they've received from their peers by logging into their Smart Profiles. They will not be able to see their own feedback unless they have given feedback to theirs first. Feedback is given consistently to everyone for each activity that is done during the programme
WHO DOES IT SUIT?
PUMAS is an ideal offering for companies and organisations wanting to track students' development. By leveraging our PUMAS Smart Profiles and proprietary algorithm, businesses can create highly diverse and dynamic learning environments. Educational institutions can enhance their Transition Year (TY) Work Experience Programmes by ensuring students are grouped to maximize exposure to different perspectives and skills. TY Challenges can use PUMAS to streamline mentor-mentee pairings, ensuring a smooth and impactful experience for all participants. Additionally, businesses can benefit from the structured feedback system and comprehensive tracking capabilities, allowing them to measure the impact of their programs effectively. PUMAS helps all these businesses foster an inclusive and reflective learning atmosphere, where participants continuously develop their skills and build valuable connections.


WHAT ARE THE BENEFITS?
For students: Students will get the opportunity to reflect on what they're good at and what they want to focus on for their skills development. They get constant feedback from their peers and reflect on what they get out of each interaction. Our algorithm always switches around the groupings to ensure that students are constantly meeting new people.
For mentors: Mentors have a very smooth experience working with PUMAS as the email will tell them who their mentees are. They also get to meet new people all the time when they have multiple interactions with different mentees and they can also get their feedback directly emailed to them.
For companies and organisations: Businesses can see the participants' dream jobs, skillsets and the skills they want to build on the dashboard. They can not only use PUMAS to take attendance but also track the impact of every interaction. They can enjoy smooth logistics whereby mentors are matched with mentees and diversity is ensured. With 40 people in a room, for example, there is an absence of chaos as everybody knows where everybody needs to go. Companies can also see all the feedback in one place and the feedback will be automatically emailed to the participants. The participants can easily see what their peers and mentors have said about them, and the mentors can also see what their mentees have said.
HERE'S WHAT WE PROVIDE
We streamline all logistical aspects for you, ensuring a seamless process from start to finish.
Maximising the diversity in the room in terms of gender, geography and skills.
Tracking impact by asking the participants to fill out a feedback form after they finish a task .
Structuring feedback in a systematic and consistent way.
Encouraging participants to reflect on interactions and lock in the learning.
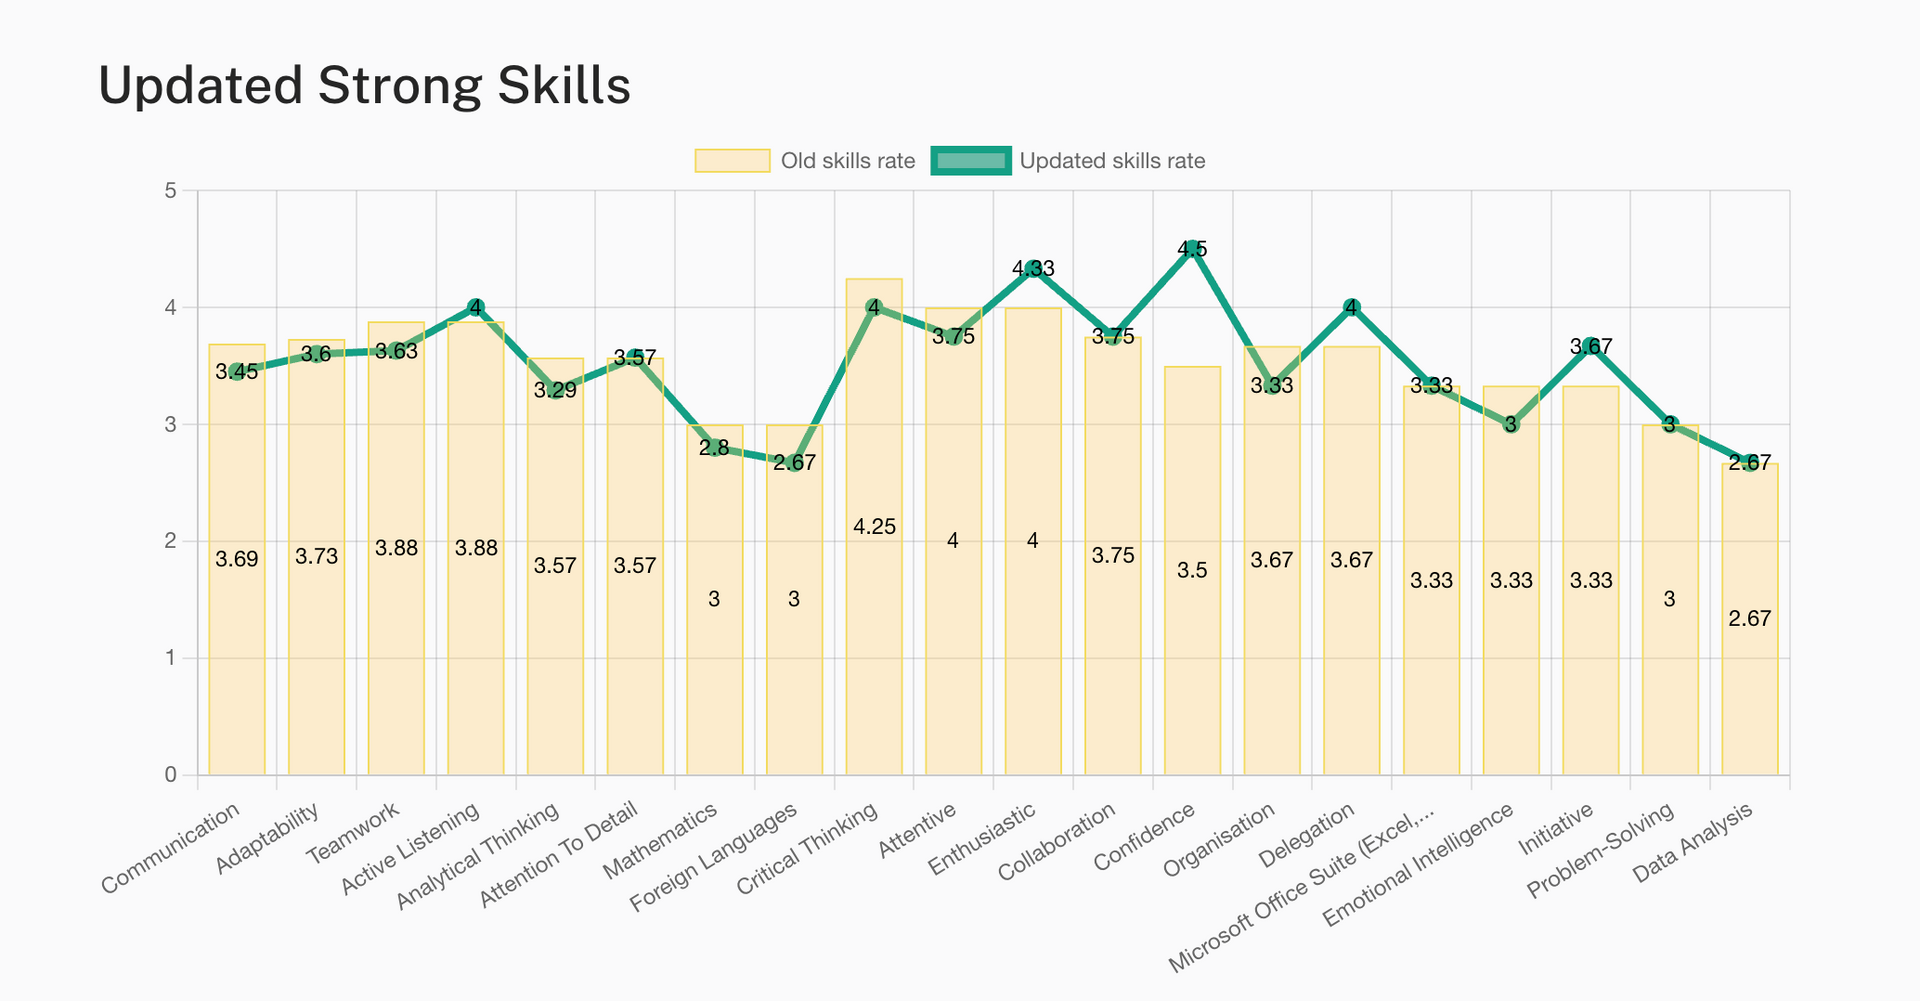
A dashboard that shows gender diversity, dream job, skills rate & count, skills opportunity and feedback statements
Developing a knowledge graph


